[생산관리] 생산라인 생산성, 숫자로 관리하는 법[Production Management] Managing Production Line Productivity by the Numbers
FREEWAYFREEWAY·2026년 7월 29일July 29, 2026·10분 읽기10 min read
제조 현장에서 "요즘 좀 바빠 보이는데 실제로 잘 돌아가고 있나?"라는 질문에 감이 아니라 숫자로 답하려면 몇 가지 기본 지표만 알아도 충분합니다. 오래된 사내 교육 자료를 다시 정리하면서, 현장에서 바로 써먹을 수 있는 개념 위주로 풀어봤습니다.
생산성이란 무엇인가
생산성은 결국 이 한 줄로 요약됩니다.
생산성 = 산출(Output) ÷ 투입(Input)
투입은 흔히 4M(Man·Machine·Material·Method), 즉 사람·설비·자재·방법으로 나눕니다. 여기에 시간까지 더해서 노동생산성·설비생산성·자본생산성처럼 투입 요소별로 따로 계산할 수도 있고, 이를 합쳐서 "종합 생산성"으로 볼 수도 있습니다.
중요한 건 생산성은 그냥 "많이 만들었다"가 아니라 투입한 자원 대비 얼마나 뽑아냈는가라는 비율 개념이라는 점입니다.
생산성은 관리되어야 한다
측정하지 않으면 통제할 수 없고, 통제하지 않으면 관리할 수 없습니다. 생산성 관리는 아래 사이클을 계속 반복하는 활동입니다.
생산성 계획 → 생산성 측정 → 생산성 평가 → (다시 계획으로)
계획만 세우고 측정을 안 하면 감으로 운영하는 것과 다르지 않고, 측정만 하고 평가·개선이 없으면 데이터만 쌓이는 걸로 끝납니다.
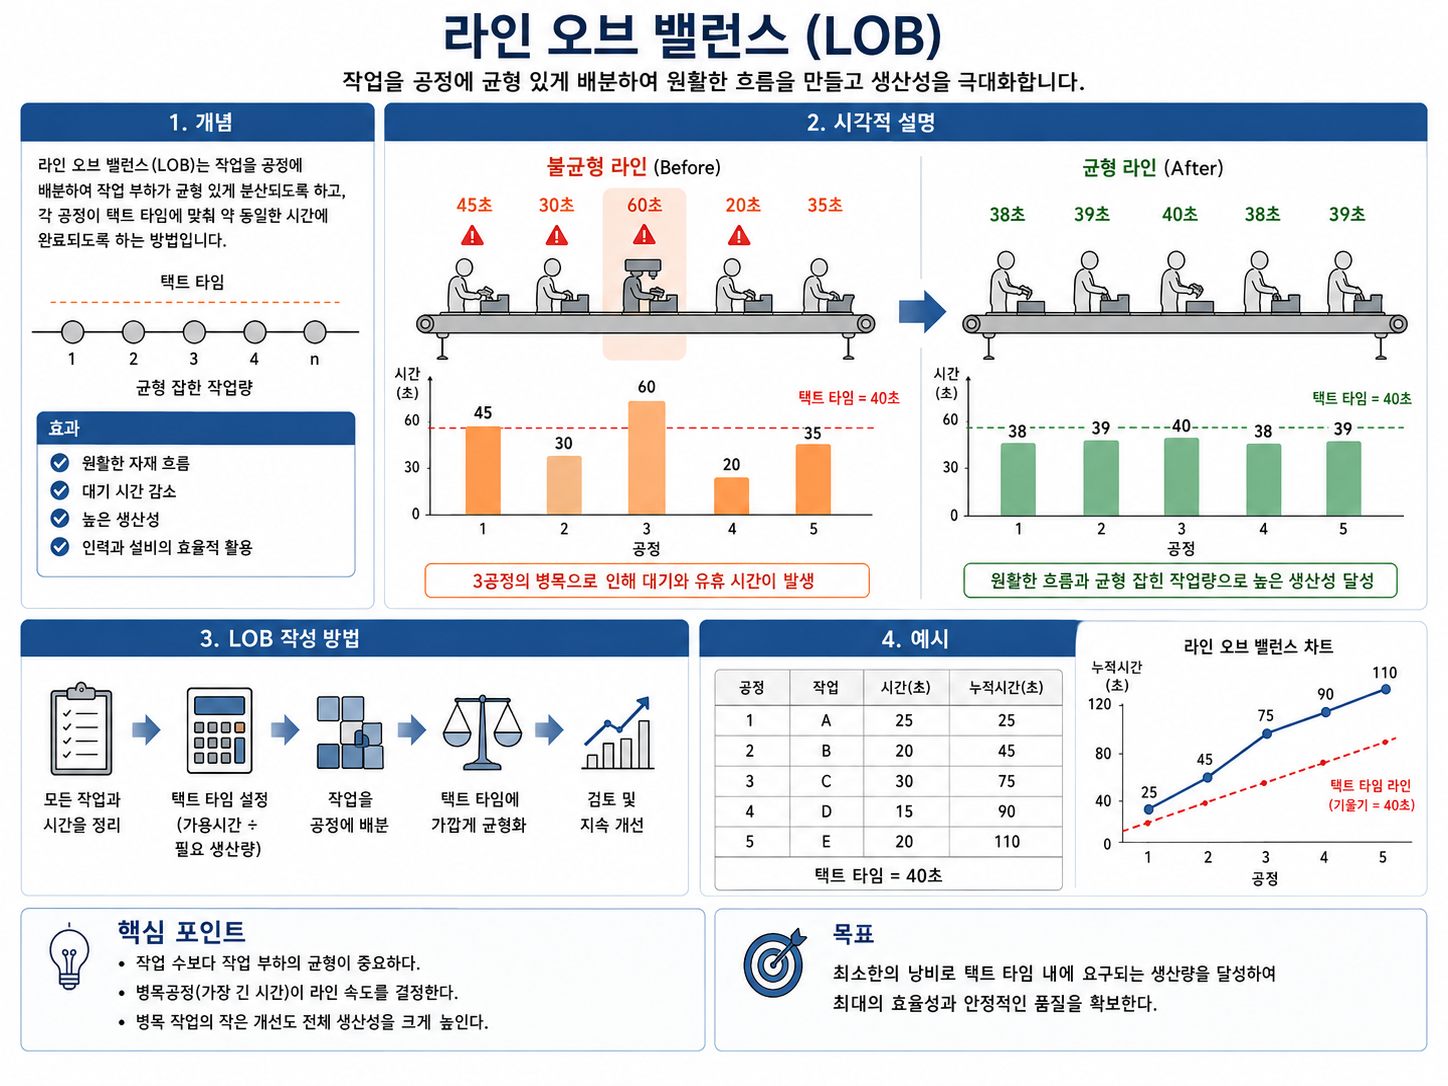
1) 라인 밸런스 (Line Balance)
여러 공정이 순서대로 이어지는 라인에서, 각 공정의 작업시간이 들쭉날쭉하면 가장 느린 공정(애로공정)이 전체 생산량을 결정해버립니다. 이걸 수치로 보는 게 라인 밸런스 효율입니다.
Eb = ∑t / (m × t_max) × 100 ∑t : 각 공정 시간의 합 / t_max : 애로공정 시간 / m : 작업 인원(공정) 수
예시
10명 라인, 각 공정 시간: 30·32·31·33·42·33·34·35·31·36초 → 애로공정 42초
라인밸런스효율 = 337 / (42×10) × 100 = 80.2%
일 생산 가능량 = (530분×60초) / 42초 = 757개
애로공정을 42초→35초로 개선하면: 효율 96%, 생산 가능량 908개 → 공정 재분배 하나로 생산성 16% 향상
라인 밸런스를 올리는 것 자체가 눈에 보이는 낭비(로스)를 잡는 가장 직관적인 방법입니다. 단, 라인이 여러 개로 늘어나면 이론상 100%였던 밸런스도 실제로는 90% 수준으로 떨어지는 게 보통입니다.
2) 낭비(Loss)의 정의
부가가치를 만들지 않는 모든 행위가 낭비입니다. 과잉생산·대기·운반·가공 자체·재고·동작·불량이 대표적입니다.
문제는 낭비 대부분이 눈에 잘 안 보인다는 점입니다. 실제 작업시간 중 70~80%가 낭비라는 조사 결과도 있을 만큼, 낭비는 익숙해지면 그냥 "원래 그런 것"으로 여겨지기 쉽습니다. 관리의 핵심은 보이지 않는 낭비를 보이는 형태로 바꾸는 것입니다. 작업 대기시간이 짧아 눈에 잘 안 띄던 걸 데이터로 쌓아서 "하루에 이만큼 손실"로 드러내는 식입니다.
3) 표준시간과 CAPA
표준시간이란 정상적인 숙련도의 작업자가, 정상적인 조건에서, 정상 속도로, 여유시간까지 포함해서 작업을 완료하는 데 필요한 시간입니다. 표준시간을 설정하는 목적은 다섯 가지입니다.
작업 계획 수립 및 CAPA(생산능력) 확인
생산성(효율) 관리
목표 생산량 산출
적정 인원 산출
표준원가 관리
부하 = 생산량 × (표준공수 × [1 + 여유율])
월 CAPA = 총 부하 / 총 보유능력 여유율: 피로·생리적 여유 등 포함, 보통 15% 내외
4) 일 목표 생산량과 적정 인원
일 목표 생산량(SPD, Stroke Per Day)을 정하는 이유는 숫자 관리뿐만 아니라 현장에 명확한 목표 의식과 동기부여를 주기 위해서입니다.
피치타임 = 근무시간 / 일 목표 생산량
적정 인원 = ∑t / 피치타임
예시
A제품 하루 430개 목표, 근무시간 530분, ∑t = 575.3초
피치타임 = 530분 / 430개 = 1.233분 (73.95초)
이론 필요인원 = 575.3 / 73.95 = 7.8명 → 8명
여유율 15% 적용 시 = (575.3×1.15) / 73.95 = 8.9명 → 9명 (현재 11명 투입 대비 2명 절감 가능)
용어
의미
애로공정 / 네크타임
라인에서 가장 오래 걸리는 공정. 그날 생산량을 좌우함
피치타임
완제품이 마지막 공정에서 나오는 평균 간격
택타임
고객 요구 수량을 납기 내 맞추기 위해 필요한 제품 1개당 시간
사이클타임
반복 작업에서 1사이클을 완료하는 데 걸리는 시간 (피치타임과 같은 의미로 쓰기도 함)
표준시간
정상 조건·정상 속도·여유시간을 포함한 표준 작업시간
5) 불량률 관리 (PPM)
불량률은 퍼센트(%)보다 PPM(Parts Per Million, 백만분율) 단위를 더 많이 씁니다. 숫자가 작아서 %로는 체감이 잘 안 되기 때문입니다. 참고로 1% = 10,000PPM입니다.
공정 불량률(PPM) = (불량 수량 / 총 생산 수량) × 1,000,000
출하 불량률(PPM) = (불합격 건수 / 총 검사 건수) × 1,000,000
일반적인 사내 공정 불량 관리 기준: 약 2,500 PPM
고객 클레임(출하) 기준: 약 1,000 PPM 이하
예시
400개 생산 중 10개 불량 → (10/400)×1,000,000 = 25,000 PPM
일 목표 300개, 근무시간 530분 → 피치타임 530/300 = 1.77분. 벨트에 1.77분 간격으로 마크를 찍으면 마크 위에 제품이 없을 때 바로 "지금 늦고 있다"는 신호가 됩니다.
피치 마크의 장점은 두 가지입니다. 목표가 눈에 보이는 형태로 자극을 주어 동기부여 효과가 크고, 하루 끝에 결과를 보는 게 아니라 실시간으로 지연 여부를 파악해 즉시 대응할 수 있습니다.
생산성 관리는 결국 "감으로 돌아가는 라인"을 "숫자로 설명 가능한 라인"으로 바꾸는 작업입니다. 라인밸런스로 병목을 찾고, 표준시간으로 적정 인원을 계산하고, PPM으로 품질을 추적하고, 피치 마크로 실시간 진행 상황을 눈에 보이게 만드는 것 — 이 네 가지만 제대로 돌아가도 현장 관리 수준이 확 달라집니다.
In manufacturing, when someone asks "looks busy out there — but is it actually running well?", answering with data instead of gut feel only requires a handful of core metrics. I went back through some old training materials and pulled out the concepts most directly applicable on the floor.
What productivity actually means
Productivity comes down to this one line:
Productivity = Output ÷ Input
Input is typically broken into 4M: Man, Machine, Material, Method. You can calculate productivity separately for each input type — labor productivity, equipment productivity, capital productivity — or combine them into an overall figure. The key point is that productivity is not "we made a lot." It's a ratio of output to resources consumed.
Productivity must be managed
You can't control what you don't measure, and you can't manage what you don't control. Production management is a continuous cycle:
Plan → Measure → Evaluate → (back to Plan)
Planning without measuring is just guessing. Measuring without evaluating and improving is just filling spreadsheets.
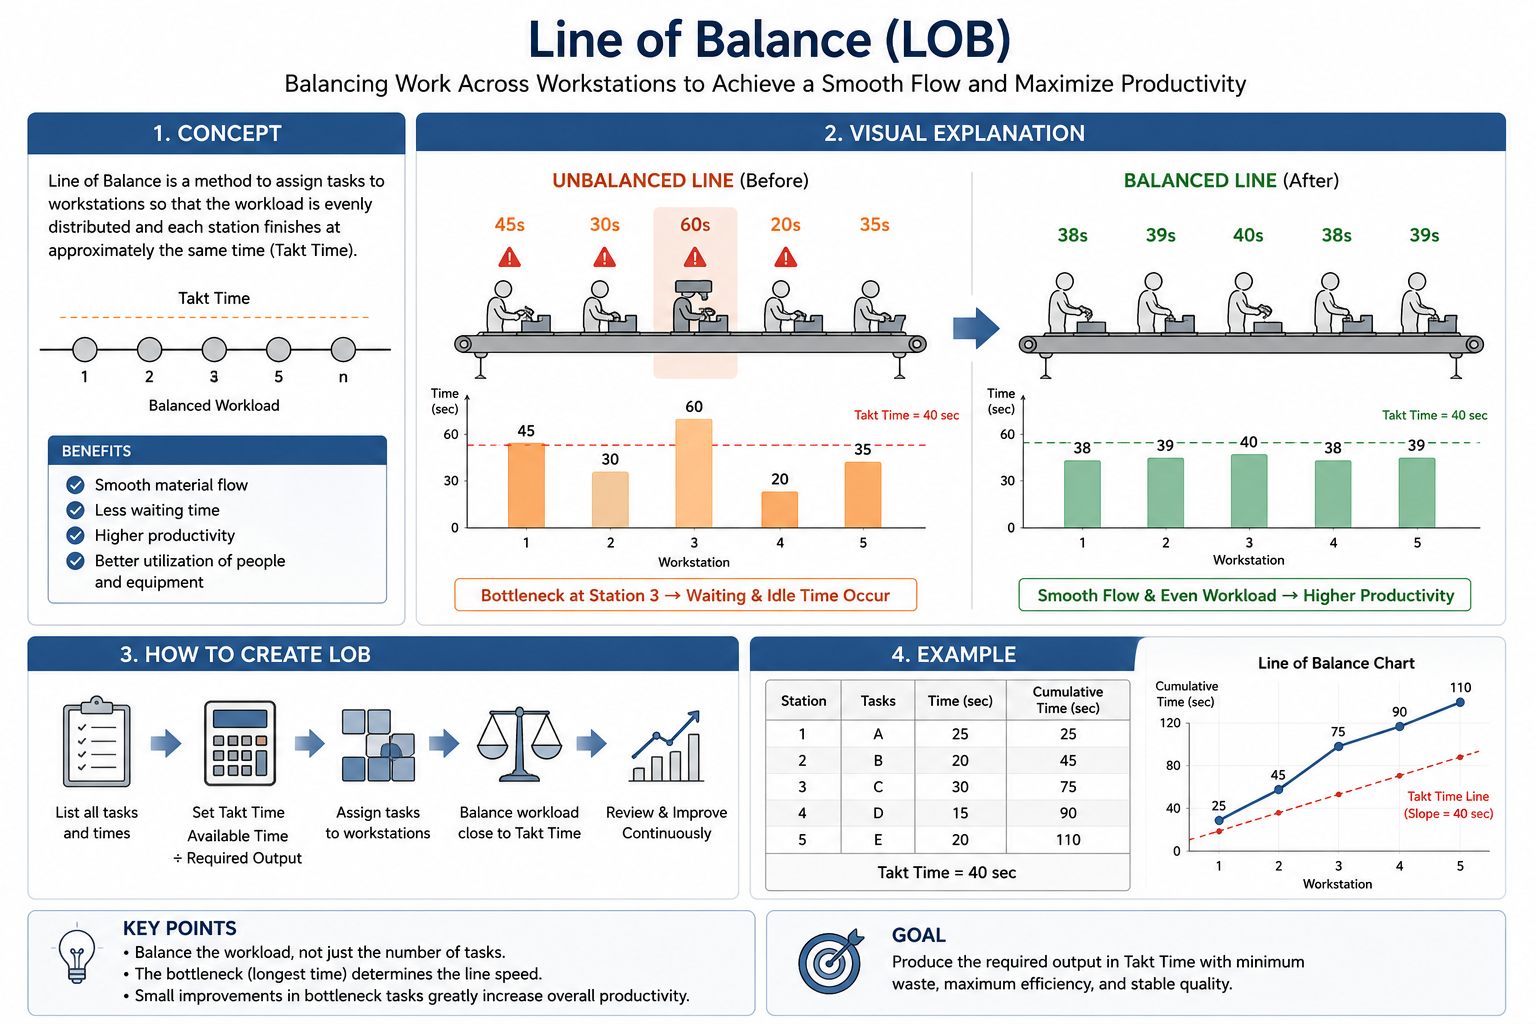
1) Line Balance
On a sequential production line, if station times vary widely, the slowest station (the bottleneck) determines total output. Line balance efficiency makes that visible as a number.
Eb = ∑t / (m × t_max) × 100 ∑t = sum of all station times / t_max = bottleneck station time / m = number of workers (stations)
Daily output = (530 min × 60 sec) / 42 sec = 757 units
Improve bottleneck from 42s → 35s: efficiency 96%, output 908 units → 16% productivity gain from one rebalancing
Improving line balance is the most direct way to eliminate visible waste. In practice, multi-line setups that look 100% balanced on paper typically run closer to 90% — that gap is usually recoverable.
2) What counts as waste
Any activity that doesn't add value is waste. The classic seven: overproduction, waiting, transport, over-processing, inventory, unnecessary motion, and defects.
The problem is that most waste is invisible until you measure it. Some studies put the share of waste in manufacturing work time at 70–80%. The reason: once you're used to it, waste just feels like "that's how it works." The goal of management is to make invisible waste visible — for example, capturing small wait times as data that adds up to "X hours lost per day."
3) Standard Time and CAPA
Standard time is the time required for a worker of average skill, working at a normal pace under normal conditions, to complete a task — including allowances for fatigue, personal time, and other interruptions. It's used for five things:
Production planning and capacity (CAPA) calculations
Efficiency tracking
Setting daily output targets
Determining optimal staffing
Standard cost accounting
Load = Volume × (Standard man-hours × [1 + Allowance rate])
Monthly CAPA = Total load / Total available capacity Allowance rate: typically ~15%, covering fatigue, physiological needs, etc.
4) Daily Output Target and Optimal Staffing
Setting a daily output target (SPD, Stroke Per Day) isn't just about tracking numbers — it gives the floor team a clear goal that drives engagement.
Pitch time = Working time / Daily output target
Optimal headcount = ∑t / Pitch time
Example
Product A: target 430 units/day, working time 530 min, ∑t = 575.3 sec
With 15% allowance: (575.3 × 1.15) / 73.95 = 8.9 → 9 people (vs. 11 currently deployed — 2 can be redeployed)
Term
Meaning
Bottleneck / Neck time
The slowest station on the line; it determines daily output
Pitch time
Average interval at which finished products exit the last station
Takt time
Available production time ÷ customer demand rate; the heartbeat the line must match
Cycle time
Time to complete one cycle of a repeating task; sometimes used interchangeably with pitch time
Standard time
Normal-pace completion time including all allowances
5) Defect Rate Management (PPM)
Defect rates are more commonly expressed in PPM (Parts Per Million) than percentage, because percentages make small defect rates hard to feel. For reference: 1% = 10,000 PPM.
In-process PPM = (Defect count / Total produced) × 1,000,000
Outgoing PPM = (Reject count / Total inspected) × 1,000,000
Typical in-process defect target: ~2,500 PPM
Customer-facing (outgoing) target: ~1,000 PPM or below
One of the most practical visual management tools on a conveyor line.
Calculate the daily output target (SPD)
Calculate pitch time (working time / target output)
Mark the conveyor belt at pitch time intervals (pitch marks)
Manage so that a product rides each mark out the other end — the loading station is the easiest control point
Track output by time window rather than waiting for the end-of-day total
Example
Daily target: 300 units, working time: 530 min → pitch time = 530/300 = 1.77 min. Mark the belt every 1.77 minutes. When a mark passes without a product on it, that's an immediate signal: "we're falling behind right now."
Pitch marks deliver two benefits: a visible goal that keeps the team motivated, and real-time lag detection so you can respond in the moment — not at the end of the shift when it's too late.
Managing production line productivity is ultimately about converting "a line that runs on feel" into "a line you can explain with numbers." Find the bottleneck with line balance, calculate optimal staffing with standard time, track quality with PPM, and make real-time progress visible with pitch marks. Get those four working together and the level of floor management changes noticeably.
댓글Comments