[산업공학(IE)] 2편: 방법연구와 공정분석 — 작업을 도표로 그려서 낭비를 찾는 법[Industrial Engineering (IE)] Part 2: Methods Research and Process Analysis — Charting Work to Reveal Waste
FREEWAYFREEWAY·2026년 8월 6일August 6, 2026·10분 읽기10 min read
시리즈 안내 — 이 글은 「산업공학(IE)」 6편 시리즈의 2편입니다.
1편: IE란 무엇인가 — 테일러부터 호손 실험까지
2편: 방법연구와 공정분석 (현재 글)
3편 이후: 연합작업분석 · 표준자료법 · PTS법 · 라인 밸런싱 예정
1편에서는 IE의 정의와 역사, 생산성 개념을 다뤘습니다. 이번 편은 IE의 실무 영역 중 하나인 방법연구, 그중에서도 가장 기초가 되는 공정분석 — 작업을 몇 가지 기호로 도표화해서 낭비를 눈에 보이게 만드는 기법 — 을 다룹니다. 실제 개선 사례(버핑 휠 재생 작업)도 함께 소개합니다.
방법연구란
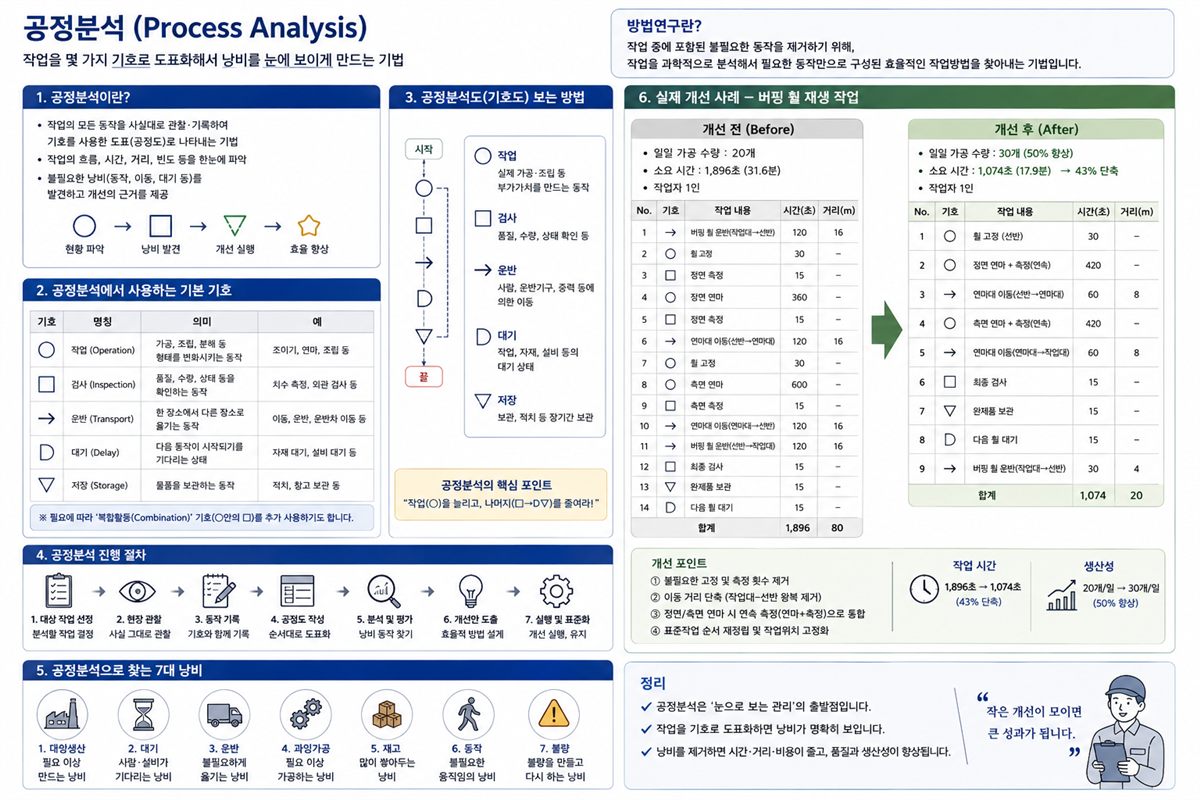
방법연구는 작업 중에 포함된 불필요한 동작을 제거하기 위해, 작업을 과학적으로 분석해서 필요한 동작만으로 구성된 효율적인 작업방법을 찾아내는 기법입니다.
방법연구의 목적
작업의 용이화, 안전화, 피로 감소
작업 사명감 증대
원가 절감
생산량 증대
재공품 감소
생산설비 최적화
품질 향상
생산기간 단축
생산공간의 유효 활용
작업환경 향상
문제해결의 절차: 기본형 5단계
방법연구를 실제로 진행할 때 쓰는 표준 절차입니다.
연구대상 선정: 경제성, 기술적인 면을 고려해서 선정
현 작업방법 분석: 차트와 도표를 사용해서 현재 방법을 기록
분석자료의 검토: 5W1H, ECRS 원칙(제거·결합·재배열·단순화)으로 검토
개선안의 수립: 개선안을 측정하고 비교
개선안의 도입: 실제 현장에 적용
필요에 따라 이 5단계를 더 세분화해서 개선안 정립, 보전 등을 추가한 8단계로 확장하기도 합니다.
한편, 문제가 아직 명확하지 않은 상태에서 새로운 걸 설계해야 할 때는 조금 다른 절차(디자인 개념 방식)를 씁니다: 문제의 형성 → 문제의 분석 → 대안의 탐색 → 대안의 평가 → 선정안의 명시. 근본적으로 비슷하지만, 문제를 인식하고 구체화하는 과정에서 접근 방식이 다릅니다.
PDCA와의 연결
방법연구의 절차는 익숙한 PDCA 사이클과도 맞닿아 있습니다: 현상 조사 → 목표 설정 → 대책 수립 → 실시 → 결과 조사 및 대책안 평가 → 다시 실시(Follow-up). 문제를 발견하는 것부터 개선을 정착시키는 것까지 계속 순환하는 구조라는 점이 같습니다.
공정분석이란
공정분석은 재료가 출고된 후 제품으로 출하되기까지의 전체 공정 흐름을 계통적으로 도표화한 것입니다.
공정분석의 목적
공정 계열을 포괄적으로 파악하기 위해
생산공정과 작업공정 개선·설계의 자료를 얻기 위해
레이아웃(LAYOUT) 개선·설계의 자료를 얻기 위해
공정편성 개선·설계의 자료를 얻기 위해
운반방법 개선·설계의 자료를 얻기 위해
제품·부품이 갖는 여러 요소의 개선·설계 자료를 얻기 위해
공정분석의 특징
대상의 주체를 도시 기호로 나타낸다
대상의 4요소(가공·검사·운반·정체)로 나눠서 분석한다
대상을 더 상세히, 전문적 분야에서 분석한다
공정분석의 종류
공정분석은 크게 두 갈래로 나뉩니다.
① 주체분석
제품공정분석: 소재나 원료가 제품화되는 과정을 분석. 단순공정분석과 세밀공정분석으로 나뉜다
단순공정분석: 작업공정도를 사용해서 가공과 검사 기호로 전체 내용을 개괄적으로 분석
세밀공정분석: 흐름공정도나 유통공정도를 사용하며, 물형공정분석이라고도 부른다
사무공정분석: 사무작업 분석에 사용 (Mundel, Nadler, JMA 방식이 있으며 기호 의미가 통일되어 있지는 않음)
작업자공정분석: 작업자가 2개 이상의 장소를 이동할 경우 적용
② 부대분석
생산대상 기준: 기능분석(가치공학), 부품분석, 제품분석, 수율분석
작업분담 기준: 경로분석, 운반활성분석, 여력분석
장소 기준: 흐름분석, PQ분석, 다품종공정도, 유입유출표
시간적 경과 기준: 일정분석, 정체분석, 유동수분석
공정분석에 쓰는 기호
공정도를 그릴 때 쓰는 기본 기호입니다 (KS 원용 기호 기준).
기호
명칭
의미
가공(작업)
원재료·부품·제품이 변형·변질·조립·분해 등 변화를 받는 상태, 또는 다음 공정을 위해 준비되는 상태
운반
원재료·부품·제품이 한 위치에서 다른 위치로 이동하는 상태 (기호 크기는 작업 기호의 1/2~1/3 정도)
정체(일시적)
원재료·부품·제품이 가공·검사되는 일 없이 저장되어 있는 상태
저장
원재료 창고 내 저장, 제품 창고 내 저장 등. 원재료 저장에서 시작해서 제품 저장으로 끝나는 게 일반적
대기(로트 정체)
로트 중 일부가 가공되고 나머지는 정지되어 있는 상태
검사(양·질)
원재료·부품·제품을 조사·측정하고 기준과 비교해서 합격·불합격을 판정하는 일
관리구분/담당구분
책임구분·공정구분 또는 담당자별 책임 범위를 나타냄
생략
공정 계열의 일부를 생략함을 표시
폐기
원재료·부품·제품 일부를 폐기하는 경우
기호 사용 규칙
공정의 연결: 일련의 공정 계열은 하나의 실선으로 연결. 분석 목적이 되는 대상의 공정 계열은 굵은 실선으로 표시
공정의 집합: 조립작업에서 여러 부품이 모이는 경우, 가공공정 기호 위쪽에 다른 공정 계열의 선을 이어서 표시
공정의 분리: 분해작업에서 몇 가지로 나뉘는 경우, 가공공정 기호 아래쪽에서 분리하는 선을 내어 표시
공정의 병행: 동일 작업이 병행해서 이뤄지는 경우, 그 앞뒤에서 실선을 분리·집합시켜 표시
시간의 기입: 1개당 가공시간과 로트 크기, 총 가공시간을 함께 기입
운반거리의 기입: 1회당 운반거리와 운반 횟수, 총 운반거리를 기입
조사항목: 목적에 따라 수량, 시간, 작업자, 작업내용, 기계, 치공구, 검사구, 용기, 비용 등을 조사
분석도의 배치: 공정 계열을 순서대로 기록한 뒤, 우측에는 작업조건을, 좌측에는 소요시간·운반거리 등을 기입
조사항목 (5요소별)
기호
요소
조사 항목 예시
작업
작업방법·조건, 작업시간, 단위시간당 생산량, 작업자(직명·기능·수준·인원수), 기계설비, 주요 치공구, 사용자재
작업공정도에는 자재가 공정으로 들어오는 지점과, 거기서 이뤄지는 검사·작업이 도식적으로 표시됩니다. "작업" 기호와 "검사" 기호 두 가지가 수직선에 연결되는 구조입니다. 수직선은 제조 순서를, 수평선은 투입되는 자재를 나타냅니다.
작성 요령으로는 주된 공정을 도표의 가장 오른쪽에 두고, 기호 크기는 3/8인치, 기호 간 간격은 1/4인치 정도로 맞추는 게 보기 좋다고 합니다. 무엇보다 중요한 건 작업이나 검사가 발생할 때마다 빠짐없이 표시하는 것 — 얼마나 세밀하게 관측했는지가 공정도의 품질을 좌우합니다.
② 조립공정도
부품을 조립해서 만드는 제품의 공정을 나타낼 때 씁니다. 작업공정도와 마찬가지로 작업·검사 두 기호를 쓰지만, 작업을 나타내는 기호 안에 조립(Assembly) 순서를 뜻하는 "A-#" 또는 중간조립(Subassembly) 순서를 뜻하는 "SA-#"를 표시하는 게 특징입니다. 공급되는 부품은 좌측에, 중간조립품이 만들어지는 과정은 우측으로 그리며, 최종제품을 한 단계씩 분해해가며 투입 부품까지 역순으로 그리는 게 작성하기 쉽습니다.
③ 유통공정도와 유통선도
유통공정도(Flow Process Chart)는 공정 중 발생하는 모든 작업·검사·운반·저장·정체를 도식화하고, 소요시간·운반거리 등의 정보도 함께 기재합니다. 작업공정도보다 훨씬 세밀하게 기록하기 때문에 보통 부품 하나를 대상으로 작성합니다. 무엇에 초점을 맞추느냐에 따라 Material Type(물자 흐름), Man Type(사람 이동), Equipment Type(설비)의 세 가지로 나뉩니다.
유통선도(Flow Diagram)는 유통공정도의 한계를 보완합니다. 유통공정도는 작업·운반·정체 등을 표시하긴 하지만 "이게 현장 어디서 발생하는지"는 알려주지 않습니다. 유통선도는 실제 평면도 위에 부품이 이동하는 경로와 번호를 발생 위치에 따라 함께 표기해서, 이동 방향을 화살표로 보여줍니다. 용도는 세 가지입니다.
시설을 재배치해서 운반거리를 줄이고 싶을 때, 새 위치 후보를 짚어낼 수 있다
기자재 소통이 혼잡한 지역을 파악할 수 있다
공정 중 역류(Backtracking) 현상이 있는지 점검할 수 있다
두 가지 이상의 부품을 동시에 나타낼 땐 각각 다른 색깔로 구분해서 그립니다.
실제 개선 사례: 마모된 버핑 휠 재생 작업
실제 사례를 통해 유통공정도·유통선도가 어떻게 개선으로 이어지는지 보겠습니다.
기존 상황: 어느 공장에서는 도금 전에 연마기에 끼운 버핑 휠로 제품 표면을 연마합니다. 휠이 마모되면 재생 작업을 합니다 — 휠에 접착제를 바르고, 금강사(연마 가루)를 입힙니다. 30분 간격으로 두 번 금강사를 입힌 뒤, 휠을 건조기 걸이에 걸어 접착제를 완전히 말립니다.
이 작업을 유통선도·유통공정도로 그려보니, 다음과 같은 의문이 자연스럽게 생겼습니다.
왜 접착제와 금강사를 작업자가 직접 발라야 하는가?
휠을 들었다 놓았다 하는 작업 횟수를 줄일 수는 없는가?
금강사를 왜 2층에서 입혀야 하는가? 1층에서 작업할 수는 없는가?
개선 내용: 이 의문들을 바탕으로 두 가지 개선안이 나왔습니다.
접착제와 금강사를 코팅할 때 시간과 노력을 절약해주는 전용 장치를 개발하고, 이 장치를 1층 창고와 건조기 사이에 배치해서 운반거리를 단축
기존 운반차 대신 걸이(rack)가 달린 대차를 고안해서, 휠을 불필요하게 내렸다 올렸다 하지 않고 대차째로 건조기나 창고에 보관
개선 결과:
구분
개선 전
개선 후
차이
작업
11회
4회
7회 감소
검사
1회
1회
변화 없음
정체
4회
1회
3회 감소
저장
2회
2회
변화 없음
운반 (운반차)
5회, 67m
3회, 24m
2회, 43m 단축
운반 (승강기)
2회, 14m
0회, 0m
2회, 14m 단축
작업 횟수는 11회에서 4회로, 정체는 4회에서 1회로 크게 줄었습니다. 여기에 새로운 합성접착제까지 도입되면서 접착제와 금강사가 휠에 더 균일하게 코팅되어 표면 처리 속도까지 빨라졌습니다. 그 결과 기존에는 작업자 4명이 시간당 20개를 코팅했지만, 개선 후에는 작업자 2명이 시간당 45개를 코팅할 수 있게 됐고, 작업능율은 25% 증가했습니다.
이 사례가 잘 보여주는 건, 공정도라는 단순한 도구 하나가 "왜 이렇게 하고 있지?"라는 질문을 자연스럽게 유도한다는 점입니다. 도표로 그려놓고 보면 안 보이던 비효율이 눈에 들어오고, 그게 곧 개선 아이디어로 이어집니다.
사무공정분석: 시스템 차트
공정분석은 제조 라인뿐 아니라 사무 업무에도 적용됩니다. 사무작업(Paper Work)이란 업무 현황이나 정보를 기록·분석·발송·보관하는 일로, 조직이 효율적으로 운영되기 위한 신경 역할을 합니다. 생산·판매·자금·인사관리 같은 업무 통제 기능도, 부서 간 소통도 결국 사무작업을 통해 이뤄집니다.
문제는 사무작업 흐름이 여러 부서에 걸쳐 있어서, 일반적인 공정도로는 도식화하기 어렵다는 점입니다. 유통공정도는 한 종류의 서류 흐름을 분석하기엔 좋지만, 여러 서류 간의 관계를 동시에 보여주기엔 부족합니다. 그래서 사무 흐름 전체를 보려면 시스템 차트(System Chart, Procedure Flow Chart)를 씁니다.
시스템 차트는 유통공정도의 기호를 사무 업무에 맞게 수정해서 씁니다.
발행: 서류가 처음 작성됨
추가: 서류에 결재 사인 등 기록이 추가됨
처리: 서류가 분류되거나 함께 철해짐
운반: 다른 사람이나 부서로 이동
점검: 서류 내용의 조사·검토
보관/처분: 서류의 보류, 보관 또는 처분
시스템 차트는 유통공정도처럼 위아래로 그리는 게 아니라 좌에서 우로 그리며, 수평선 한 칸에는 한 종류의 서류만 할당하는 게 원칙입니다. 수직 방향으로 같은 위치에 그려진 기호라도 반드시 같은 시점에 수행됨을 뜻하지는 않습니다.
예시: 어느 제조회사에서 자재를 생산에 투입하기 위한 서류 흐름을 보면 이렇습니다. 생산부서 자재담당이 출고의뢰서·출고전표·대체출금전표 세 가지를 작성해 과장에게 보내고, 과장·부장 결재를 거친 서류를 창고담당에게 제시합니다. 창고담당은 자재저장카드와 출고의뢰서를 대조해서, 물건이 있으면 인도하고 품절이면 물품구입신청서를 두 장 작성해 날인 후 공장업무과로 보냅니다. 업무과장의 승인과 전결 규정에 따른 절차를 거친 뒤, 원본은 창고담당이 보관하고 사본은 본사 구매담당에게 전달됩니다. 구매담당은 신청서를 받는 즉시 납품업자 3명에게서 견적서를 받습니다.
이렇게 여러 부서를 오가는 서류 흐름을 시스템 차트로 그려보면, 불필요하게 중복되는 결재 단계나 서류가 어디서 지연되는지 한눈에 파악할 수 있습니다 — 앞선 버핑 휠 사례와 원리는 완전히 같습니다.
다음 편(3편)에서는 작업분석 — 특히 작업자와 기계의 연계를 다루는 연합작업분석(Man-Machine Chart, Gang Process Chart)과, 표준시간을 간접적으로 구하는 표준자료법을 다룰 예정입니다. 실제 계산 사례(작업자-기계 담당 대수 결정, 제지공장 절단 작업 비용 분석 등)도 함께 소개하겠습니다.
Series note — This is Part 2 of 6 in the Industrial Engineering (IE) series.
Part 1: What Is IE? — From Taylor to the Hawthorne Experiments
Part 2: Methods Research and Process Analysis (this article)
Parts 3–6: Man-Machine analysis · Standard data · PTS methods · Line balancing (upcoming)
Part 1 covered IE's definition, history, and the concept of productivity. This installment focuses on one of IE's practical domains — methods research — and specifically its most fundamental tool: process analysis, the technique of charting work with a handful of symbols to make hidden waste visible. A real improvement case study (buffing wheel reconditioning) is included.
What Is Methods Research?
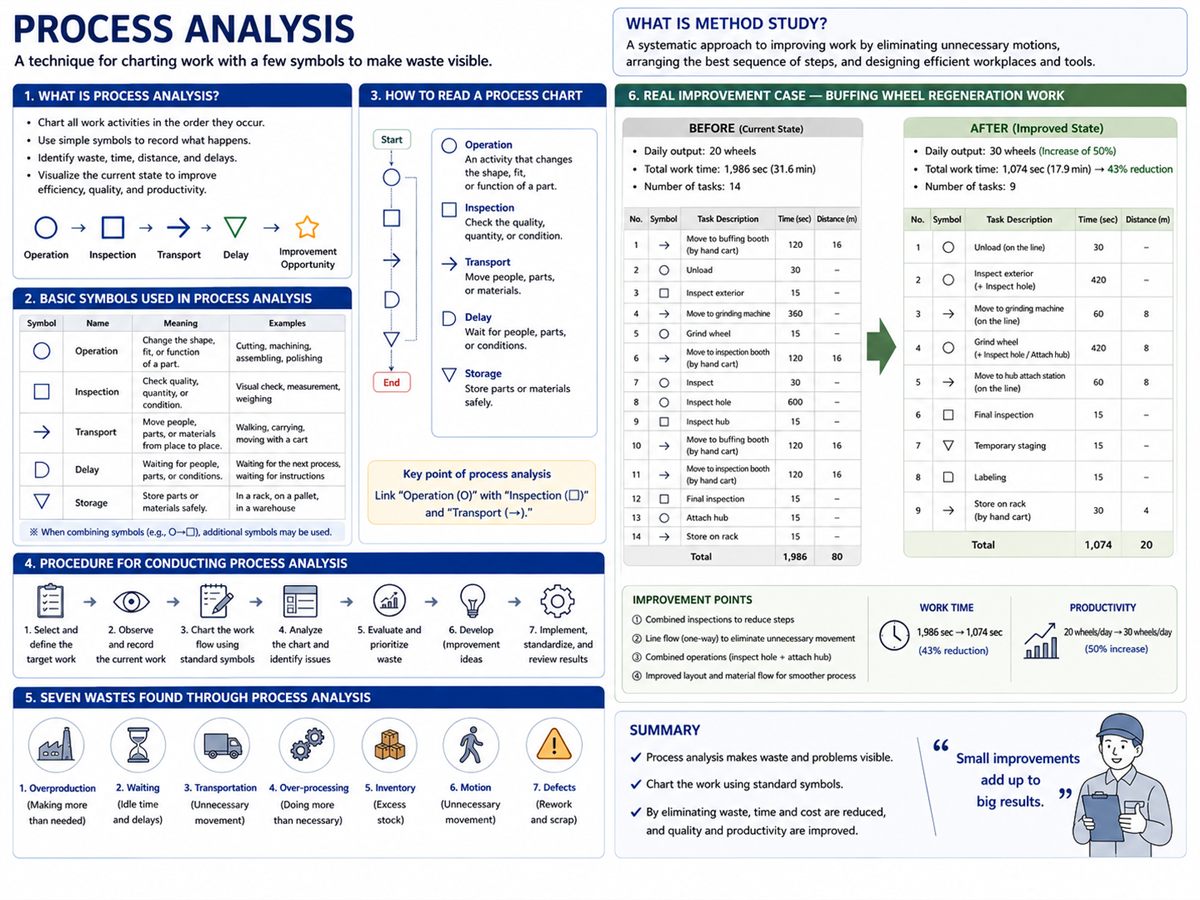
Methods research is the technique of scientifically analyzing work in order to eliminate unnecessary motions, arriving at an efficient working method made up of only the necessary movements.
Ten Goals of Methods Research
Making work easier, safer, and less fatiguing
Increasing a sense of mission in work
Cost reduction
Increased output
Reduced work-in-progress
Optimizing production equipment
Quality improvement
Shorter production lead times
Better use of production space
Improved working environment
The Five-Step Problem-Solving Procedure
The standard procedure for conducting methods research in practice.
Select the subject: choose based on economic and technical considerations
Analyze the current method: record the present method using charts and diagrams
Review the data: apply 5W1H and the ECRS principles (Eliminate · Combine · Rearrange · Simplify)
Develop the improvement: measure and compare alternatives
Implement the improvement: apply the new method on the shop floor
When needed, these five steps can be expanded into an eight-step version that adds improvement formalization and maintenance.
When the problem has not yet been clearly defined and something new needs to be designed, a different approach (the design concept method) is used: define the problem → analyze the problem → explore alternatives → evaluate alternatives → specify the chosen solution. The approach to recognizing and articulating the problem is different, though the overall logic is similar.
Connection to PDCA
The methods research procedure maps directly onto the familiar PDCA cycle: survey current state → set target → plan countermeasures → implement → evaluate results → follow up. Both are continuous loops, from finding a problem to making an improvement stick.
What Is Process Analysis?
Process analysis is the systematic charting of the entire flow of a process — from when material leaves the warehouse to when it ships as a finished product.
Goals of Process Analysis
Getting a comprehensive picture of the process sequence
Gathering data for improving or designing production and work processes
Gathering data for improving or designing layout
Gathering data for improving or designing process structure
Gathering data for improving or designing material handling methods
Gathering data for improving or designing product and component elements
Characteristics of Process Analysis
The subject of analysis is represented by chart symbols
The subject is divided into four elements for analysis: operation, inspection, transportation, and delay
The subject is analyzed in more detail within a specialized domain
Types of Process Analysis
① Primary analysis
Product process analysis: analyzes how raw material or ingredients become a finished product. Divided into simple and detailed forms:
Simple process analysis: uses operation process charts with just operation and inspection symbols for a broad overview
Detailed process analysis: uses flow process charts or flow diagrams; also called material-type process analysis
Office process analysis: applied to office work (Mundel, Nadler, and JMA methods exist — symbol meanings are not unified across them)
Worker process analysis: applied when a worker moves between two or more locations
② Supplementary analysis
By production subject: function analysis (value engineering), component analysis, product analysis, yield analysis
By work assignment: route analysis, material handling activity analysis, capacity analysis
By location: flow analysis, PQ analysis, multi-product process chart, from-to chart
By time: schedule analysis, delay analysis, flow number analysis
Process Chart Symbols
The basic symbols used when drawing process charts (KS standard).
Symbol
Name
Meaning
Operation
Raw material, component, or product undergoes a change (transformation, assembly, disassembly, etc.), or is prepared for the next operation
Transportation
Material moves from one location to another (symbol drawn at 1/2 to 1/3 the size of the operation symbol)
Temporary delay
Material is held without being processed or inspected
Storage
Material held in a warehouse; typically begins with raw material storage and ends with finished goods storage
Lot delay
Part of a lot is being processed while the rest waits
Inspection
Material is examined, measured, and compared against a standard to pass or reject it
Control / responsibility boundary
Marks a boundary between responsibility zones or departments
Omission
Indicates that part of the process sequence is omitted
Disposal
Some material, component, or product is scrapped
Rules for Using Symbols
Connecting processes: a continuous process sequence is connected by a single line; the sequence being analyzed is shown with a bold line
Joining processes: in assembly operations, other process lines join at the top of the operation symbol
Splitting processes: in disassembly, separate lines branch out below the operation symbol
Parallel processes: when the same work occurs simultaneously, lines branch out before and rejoin after
Recording time: record processing time per unit, lot size, and total processing time
Recording distance: record distance per trip, number of trips, and total distance
Survey items: depending on the purpose, record quantity, time, operator, work content, machine, jigs/fixtures, gauges, container arrangement, cost, etc.
Chart layout: processes are listed in sequence; working conditions go to the right, time and distance to the left
Survey Items by Element
Symbol
Element
Example survey items
Operation
Work method and conditions, time, output per unit time, operator (title, skill level, headcount), machine/equipment, key jigs and fixtures, materials used
Inspection
Inspection method, inspection points, standards, defect causes and rate, inspector (title, skill level), inspection equipment, inspection time
Transportation
Distance, quantity per trip, trips per lot, method and means, time
Delay
Delay duration, cause, person responsible
Storage
Location, method, quantity
Types of Process Charts
① Operation Process Chart
The operation process chart shows where materials enter the process and what inspections and operations occur at each point. It uses just two symbols — operation and inspection — connected by a vertical line. The vertical line represents manufacturing sequence; horizontal lines represent incoming materials.
Layout convention: the primary process goes on the far right. Symbols are typically 3/8 inch in size with 1/4 inch spacing. What matters most is recording every operation and inspection without omission — the granularity of observation determines the quality of the chart.
② Assembly Process Chart
Used when the product is built by assembling components. Like the operation process chart, it uses operation and inspection symbols, but each operation symbol also carries an assembly sequence number ("A-#") or subassembly sequence number ("SA-#"). Components are drawn on the left; the subassembly sequence progresses to the right. The easiest approach is to start from the finished product, decompose it step by step, and work backward to the input components.
③ Flow Process Chart and Flow Diagram
The flow process chart documents every operation, inspection, transportation, storage, and delay in a process, along with time and distance. Because it records everything in detail, it is usually applied to a single component at a time. Depending on the focus, it comes in three types: Material Type (material flow), Man Type (worker movement), and Equipment Type.
The flow diagram complements the flow process chart. The flow process chart shows what happens and in what sequence, but not where in the facility it happens. The flow diagram overlays the process chart numbering onto an actual floor plan and shows movement direction with arrows. It serves three purposes:
Identifies candidate locations when rearranging facilities to shorten transport distance
Reveals congested areas in material flow
Checks whether backtracking exists in the process
When charting two or more components simultaneously, each is drawn in a different color.
A Real Improvement Case: Buffing Wheel Reconditioning
A case from the original textbook shows how flow process charts and flow diagrams lead directly to improvement.
Original situation: A factory uses buffing wheels mounted on grinding machines to polish product surfaces before electroplating. When a wheel wears out, it is reconditioned — adhesive is applied to the wheel and abrasive grit is coated onto it. Grit is applied twice at 30-minute intervals; then the wheels are hung on a rack inside a dryer until the adhesive is fully cured.
Drawing the flow diagram and flow process chart immediately raised these questions:
Why must the operator apply the adhesive and grit by hand?
Can the number of times each wheel is picked up and set down be reduced?
Why does grit have to be applied on the second floor? Can it be done on the first floor instead?
Improvements made: Two improvements followed from those questions.
A dedicated device was developed to apply adhesive and grit with less time and effort, and this device was positioned between the first-floor storage area and the dryer to shorten transport distance
A purpose-built rack trolley was designed so that wheels could be moved on the trolley itself — without repeatedly lifting them off and placing them back on racks — and stored in the dryer or warehouse trolley and all
Results:
Category
Before
After
Change
Operations
11
4
−7
Inspections
1
1
0
Delays
4
1
−3
Storage
2
2
0
Transport (trolley)
5 trips, 67 m
3 trips, 24 m
−2 trips, −43 m
Transport (elevator)
2 trips, 14 m
0 trips, 0 m
−2 trips, −14 m
Operations dropped from 11 to 4; delays from 4 to 1. The introduction of a new synthetic adhesive also made the coating more uniform, which sped up polishing. The net result: before, 4 workers coated 20 wheels per hour; after, 2 workers coated 45 wheels per hour, with work efficiency up 25%.
What this case illustrates is that a simple charting tool naturally prompts the question "Why are we doing it this way?" Once a process is drawn out, inefficiencies that were invisible become obvious — and that visibility is what generates improvement ideas.
Office Process Analysis: The System Chart
Process analysis applies to office work as well as to the shop floor. Office work — recording, analyzing, transmitting, and storing information — is the nervous system of an efficient organization. Production control, sales, finance, and HR management all run through paperwork; so does communication between departments.
The challenge is that office work flows across multiple departments, making it difficult to chart with a standard process chart. Flow process charts work well for one type of document, but cannot show the relationships among multiple documents simultaneously. For a full view of office flow, the system chart (also called a procedure flow chart) is used.
The system chart adapts flow process chart symbols for office work:
Origination: a document is created for the first time
Addition: an entry is added (signature, approval stamp, etc.)
Processing: documents are sorted or filed together
Transportation: moved to another person or department
Review: content is examined or verified
Storage/Disposal: document is held, filed, or discarded
The system chart is drawn left to right (not top to bottom like a flow process chart), and each horizontal lane holds only one type of document. Symbols at the same vertical position do not necessarily occur at the same time.
Example: In a manufacturing company, the flow of documents needed to issue materials to production begins with the production department's materials clerk creating three documents — a material requisition, an issue slip, and a transfer debit slip — and sending them to the section chief. After approval by section chief and department head, the documents go to the warehouse clerk. The warehouse clerk checks against the inventory card: if stock is available, the material is issued; if not, two copies of a purchase request are prepared, stamped, and sent to the plant administration section. After the plant manager's approval and delegation rules, the original is retained by the warehouse clerk and the copy goes to the head office purchasing department, which immediately requests quotes from three suppliers.
Charting this multi-department document flow in a system chart immediately reveals any redundant approval steps or where documents are being delayed — the same principle as the buffing wheel case, applied to paperwork.
Part 3 will cover work analysis — specifically man-machine charts and gang process charts (combined operation analysis linking workers and machines), and standard data methods for setting standard times indirectly. Real calculation examples will be included: determining the number of machines one worker should tend, and a cost analysis of a paper-cutting operation.
댓글Comments