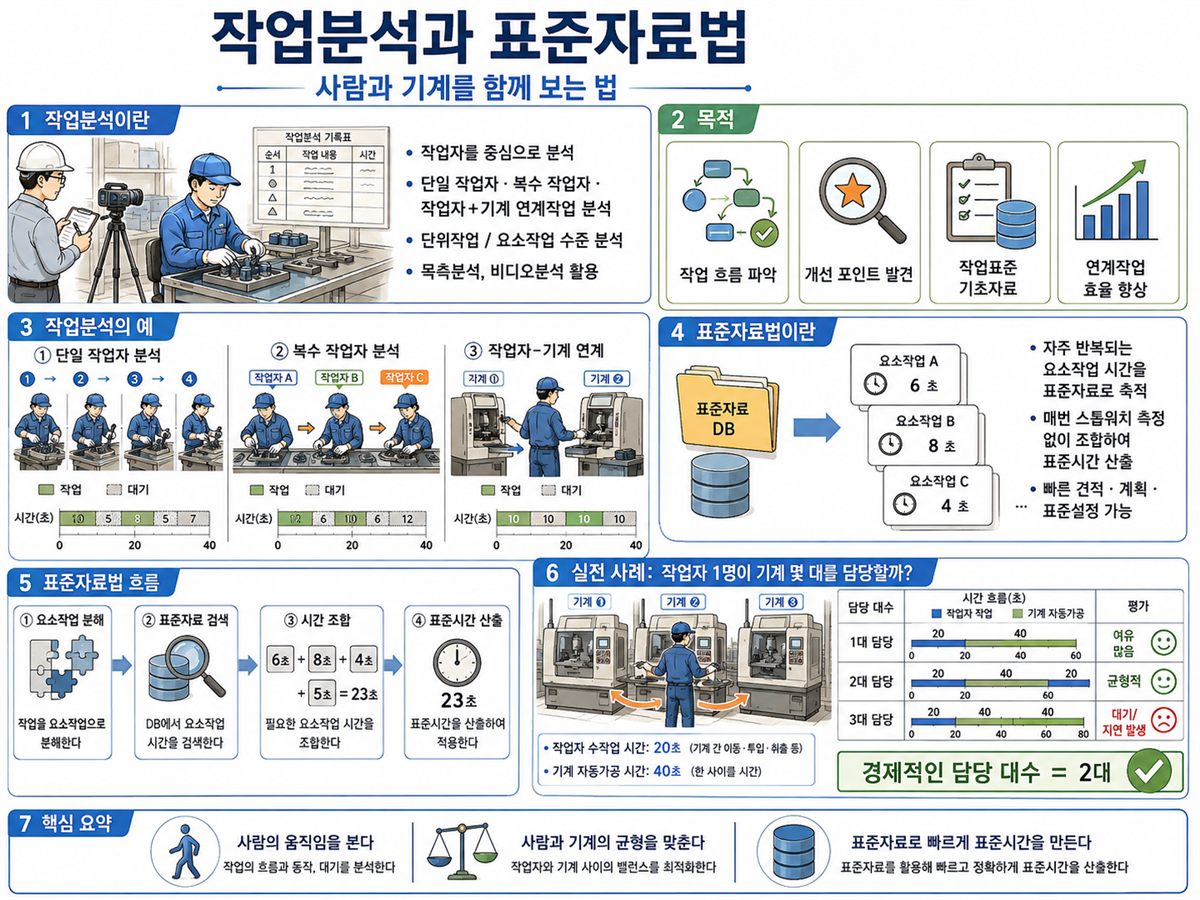
공정분석(2편)이 전체 흐름을 조감하는 지도라면, 작업분석(Work Analysis)은 한 작업장 안에서 작업자와 기계가 시간을 어떻게 나눠 쓰는지를 초 단위로 들여다보는 현미경이다. 특히 자동화 기계가 돌아가는 동안 작업자가 멍하니 서 있거나, 반대로 기계가 기다리는 상황을 가시화해 줄 때 위력을 발휘한다.
작업분석의 목적은 세 가지다.
작업자·기계의 유휴 시간을 찾아낸다.
작업자 1명이 담당할 수 있는 최적 기계 대수를 계산한다.
팀 작업에서 인원 배분의 낭비와 병목을 드러낸다.
분석 결과는 시간축 막대 차트 형태로 그려지며, 작업자와 기계의 활동 구간(작업·대기·유휴)이 나란히 놓여 한눈에 비교된다. 이를 다중활동분석표(Multiple Activity Chart) 또는 연합작업분석표라고도 부른다.
연합작업분석의 종류
분석 대상 조합에 따라 다음과 같이 구분된다.
명칭
분석 대상
작업자-기계작업분석표 (Man-Machine Chart)
작업자 1명이 기계 1대를 담당하는 경우
작업자-복수기계작업분석표
작업자 1명이 기계 2대 이상을 순환 담당
복수작업자분석표 (Gang Process Chart)
여러 작업자가 조를 이루어 협동하는 경우
복수작업자-기계작업분석표
2인 이상이 기계 1대를 함께 운영
복수작업자-복수기계작업분석표
2인 이상이 기계 2대 이상을 협동 운영
작업자-기계작업분석표: 몇 대를 담당시켜야 경제적인가
기계결합(Machine Coupling) 개념
자동 사이클 기계에서 기계가 돌아가는 동안 작업자 손이 비게 된다. 이 유휴 시간을 활용해 같은 종류의 기계를 추가로 맡기는 것이 기계결합이다. 담당 대수가 늘어날수록 기계 유휴는 줄지만 어느 순간부터는 작업자가 따라가지 못해 기계 대기가 발생한다.
최적 담당 대수 계산
작업자 1명이 기계 n대를 담당할 때 대기 없이 순환할 수 있는 최대 대수를 구하는 식은 다음과 같다.
n' = (a + t) / (a + b)
a: 1대당 수동 작업 시간 (작업자 직접 개입)
t: 기계 자동 가동 시간
b: 작업자의 기계 간 이동·준비 시간
n'이 정수가 아닐 경우 내림·올림 두 가지 대수를 모두 검토해 비용을 비교한다. 개당 가변비용이 가장 낮은 대수를 선택한다.
비용 비교 사례
아래는 절삭 기계를 1·2·3대 담당시켰을 때의 경제성 비교다(작업자 시간당 임금 2,000원, 기계 시간당 비용 2,500원 가정).
구분
1대 담당
2대 담당
3대 담당
사이클 시간
4분
4분
4.5분
시간당 생산량
15개
30개
40개
시간당 비용
4,000원
7,000원
10,000원
개당 가변비용
267원
233원
250원
3대를 담당하면 생산량은 가장 많지만 개당 비용은 2대 담당(233원)보다 높다. 이 사례에서는 2대 담당이 최적이다.
Gang Process Chart: 몇 명이 기계 한 대를 다뤄야 하는가
Gang Process Chart(복수작업자분석표)는 팀 단위 작업에서 인원 배분의 타당성을 검증한다. 각 작업자가 시간축에 어떻게 배치되는지를 그려 중복 대기·유휴를 찾아낸다.
제지공장 두루마리 절단 작업 사례
제지공장의 두루마리 절단기는 연간 100,000분 가동한다. 절단 중간에 심봉을 교체하거나 칼날 간격을 조정해야 한다.
항목
계산
연간 시간
기계 가동
—
100,000분
심봉 교체 (19,000회 × 7분)
19,000 × 7
133,000분
심봉 교체 + 칼날간격 조정 (1,000회 × 15분)
1,000 × 15
15,000분
총 작업시간
—
248,000분 (4,133시간)
총 작업시간에서 기계 가동 시간을 빼면 작업자 전용 작업(심봉 교체·칼날 조정) 시간이 나온다. 이를 기반으로 몇 명의 작업자가 필요한지, 또는 한 명이 여러 작업을 겸임할 수 있는지를 결정한다.
Gang Process Chart의 분석 결과로 인원을 줄이거나 작업을 재분배하면, 유휴 시간이 큰 작업자의 업무에 다른 작업을 추가해 전체 생산성을 높일 수 있다.
작업자-기계·복수작업자 분석표 검토 사항
분석표를 그린 뒤에는 다음 항목을 체계적으로 검토한다.
작업자-기계작업분석표 검토
작업자나 기계의 유휴 시간이 과도하지 않은가?
기계 자동 사이클 중 수동 작업을 분리해 다른 기계를 추가 담당할 수 있는가?
수동 작업 시간(a)을 단축해 담당 대수를 늘릴 수 있는가?
기계 가동 시간(t)을 연장하거나 단축해 사이클을 최적화할 수 있는가?
개당 비용 기준으로 최적 담당 대수는 몇 대인가?
복수작업자분석표 검토
각 작업자의 유휴 구간이 집중되어 있는가, 분산되어 있는가?
유휴 시간이 큰 작업자에게 보조 작업을 부여할 수 있는가?
작업 순서를 바꾸면 병목 없이 인원을 줄일 수 있는가?
기계의 대기(가동 가능한데 작업자가 없는 상태)가 빈번하게 발생하는가?
표준자료법 — 매번 재지 않고 표준시간 구하기
개념
표준자료법(Standard Data Method)은 과거에 시간연구로 측정해 축적한 데이터를 작업 요소별로 정리해 두고, 유사한 작업이 새로 생길 때 재측정 없이 표준시간을 합성하는 방법이다.
전제는 간단하다. 비슷한 작업이 반복될 때, 각 작업 요소의 정미시간은 일정한 패턴을 따른다. 드릴 작업이라면 구멍 지름·깊이·재질이 변하면 시간이 달라지지만, 그 관계를 수식으로 정리해 두면 매번 스톱워치를 들 필요가 없다.
표준자료 작성 절차
분석 대상 작업의 요소 작업을 분류한다.
각 요소 작업별로 충분한 횟수를 시간연구해 정미시간 데이터를 모은다.
시간에 영향을 주는 독립변수(지름, 깊이, 중량 등)를 파악한다.
독립변수와 시간 사이의 관계를 수식(단순·다중 회귀) 또는 표·그래프로 정리한다.
정리된 자료를 검증용 데이터로 테스트한 뒤 현장에 배포한다.
드릴 작업 표준자료 예시
드릴 가공은 ①고정 → ②위치결정 → ③드릴링 → ④탈착의 4요소로 나뉜다. 드릴링 시간은 구멍 지름과 깊이에 따라 달라지므로, 미리 측정한 데이터로 표를 만들어 둔다. 새 제품 도면이 나오면 표에서 해당 요소의 시간을 읽어 합산하면 표준시간이 된다.
다중회귀 적용 — 사무실 청소 표준자료
청소 작업처럼 복잡한 작업은 단일 변수로는 시간을 예측하기 어렵다. 이때 다중회귀분석을 쓴다.
NT = 0.85 + 0.001V1 + 0.003V2 + 0.12V3
V1: 청소 면적(㎡)
V2: 가구·집기 수(개)
V3: 층수 이동 횟수
이 수식 하나로 어떤 사무실이든 청소 견적 시간을 빠르게 계산할 수 있다. 청소 용역 회사가 입찰 전에 투입 인원을 결정할 때 실제로 활용되는 방식이다.
표준자료법의 장단점
장점
단점
매번 현장 측정 없이 표준시간 산출 가능
초기 데이터 수집·분석에 시간과 비용이 많이 든다
신제품·신규 작업에도 빠르게 적용
적용 범위가 데이터 수집 범위로 제한된다
측정자에 따른 편차 없이 일관성 유지
작업 방법·설비가 바뀌면 자료를 재작성해야 한다
견적·생산계획에 즉시 활용
처음 구축 시 측정 전문가가 필요하다
PTS법 — 동작 단위로 시간을 합성하기
개념
PTS법(Predetermined Time Standards)은 "손 뻗기", "잡기", "이동", "놓기" 같은 기본 동작(Motion Element) 하나하나에 미리 표준시간을 부여해 놓고, 작업을 기본 동작으로 분해한 뒤 합산하는 방법이다.
벽돌 비유가 직관적이다. 복잡한 건물도 결국 벽돌(기본 동작)을 쌓아 올린 것이다. 벽돌 하나의 크기(시간)를 미리 알면, 쌓는 방식만 설계하면 전체 크기를 계산할 수 있다.
스톱워치 측정이 전혀 필요 없으므로, 작업이 시작되기 전에 — 심지어 설비 설계 단계에서 — 표준시간을 결정할 수 있다. 이것이 PTS법의 가장 큰 장점이다.
대표 시스템
MTM (Methods-Time Measurement): Maynard, Stegemerten, Schwab이 1948년 개발. 기본 동작을 Reach, Move, Turn, Apply Pressure, Grasp, Release, Disengage 등으로 분류하고 거리·무게·동작 조건에 따라 시간을 부여.
WF (Work Factor): Quick, Shea, Koehler가 개발. 작업 난이도(방향·조심성·정밀도)를 요인(Work Factor)으로 수치화해 시간에 반영.
두 시스템 모두 시간 단위로 TMU(Time Measurement Unit, 1 TMU = 0.036초)를 쓴다.
PTS법의 장단점
장점
단점
작업 전 설계 단계에서 표준시간 결정 가능
분석자 교육 기간이 6개월~1년으로 길다
동작 분석과 방법 개선을 동시에 진행
기본 동작 분류에 주관이 개입될 수 있다
스톱워치 없이 실험실·설계 단계에서 활용
인지 작업·판단 작업에는 적용이 어렵다
국제 표준이라 기업 간 비교 가능
동작 분해가 지나치게 세밀해 작성에 시간이 걸린다
세 가지 방법의 위치
표준시간을 구하는 방법은 목적과 상황에 따라 선택한다.
방법
언제 쓰나
핵심 전제
스톱워치법 (2편)
현장 작업이 이미 진행 중일 때
대상 작업이 존재하고 반복 측정 가능
표준자료법
유사 작업이 자주 새로 생길 때
과거 측정 데이터가 축적되어 있다
PTS법
작업 설계·설비 설계 단계
기본 동작으로 분해할 수 있는 작업
현장에서 세 방법을 혼용하는 경우도 많다. 신제품 도입 초기에는 PTS법으로 설계 표준을 만들고, 양산 후 스톱워치법으로 보정하고, 유사 제품이 늘어나면 표준자료로 전환하는 흐름이 일반적이다.
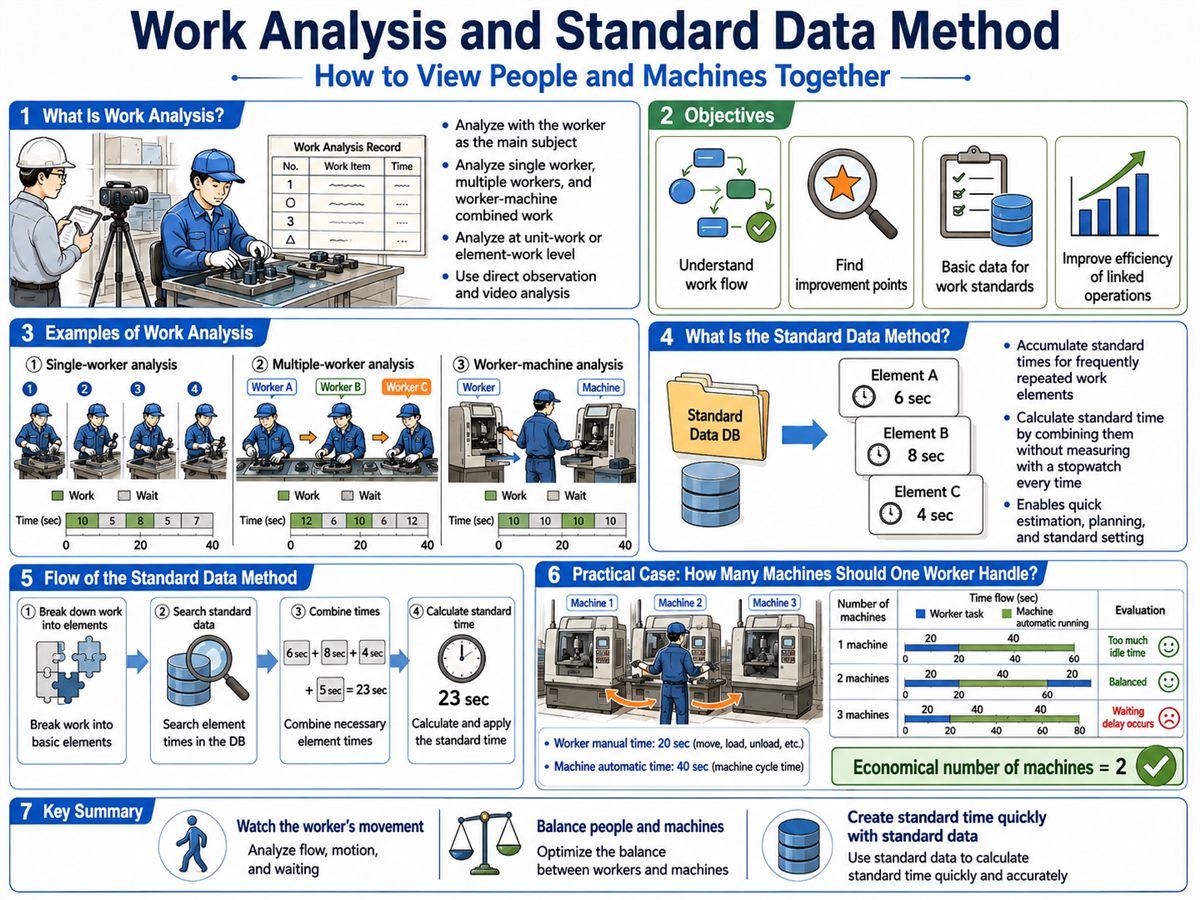
If process analysis (Part 2) is a map of the entire flow, work analysis is a microscope focused on a single workstation — showing second by second how a worker and machine share their time. It's most powerful when it reveals workers standing idle while a machine runs automatically, or machines waiting for a worker who's tied up elsewhere.
Work analysis has three objectives:
Identify idle time for both workers and machines.
Calculate the optimal number of machines one worker can handle.
Expose waste and bottlenecks in team operations.
The output is a time-scaled bar chart showing each worker and machine as a horizontal lane, with segments for working, waiting, and idle. This is called a Multiple Activity Chart or combined operation chart.
Types of Combined Operation Analysis
Chart type
Subjects analyzed
Man-Machine Chart
1 worker operating 1 machine
Man-Multimachine Chart
1 worker tending 2 or more machines in rotation
Gang Process Chart
Multiple workers cooperating as a team
Multi-worker Machine Chart
2+ workers operating 1 machine together
Multi-worker Multimachine Chart
2+ workers operating 2+ machines together
Man-Machine Chart: How Many Machines Should One Worker Run?
Machine Coupling
When a machine runs on automatic cycle, the worker's hands are free. Machine coupling means assigning that worker to an additional machine during the automatic run time. More machines means fewer machine idle periods — but push it too far and machines start waiting for the worker.
Optimal Machine Count Formula
The maximum number of machines n one worker can tend without causing machine wait time is:
n' = (a + t) / (a + b)
a: manual work time per machine (worker directly involved)
t: automatic machine cycle time
b: walk and setup time between machines
If n' is not a whole number, evaluate both the floor and ceiling values by comparing cost per unit, then choose whichever is lower.
Cost Comparison Example
The table below compares economics when one worker tends 1, 2, or 3 cutting machines (assuming labor cost ₩2,000/hr, machine cost ₩2,500/hr each).
Item
1 machine
2 machines
3 machines
Cycle time
4 min
4 min
4.5 min
Output per hour
15 pcs
30 pcs
40 pcs
Hourly cost
₩4,000
₩7,000
₩10,000
Variable cost per unit
₩267
₩233
₩250
Three machines yields the highest output but not the lowest unit cost. Two machines is optimal at ₩233 per unit.
Gang Process Chart: How Many People Does One Machine Need?
The Gang Process Chart checks whether team size and task assignments make sense. Each worker appears as a lane on a time axis, exposing overlapping idle time and unnecessary waiting.
Paper Mill Slitting Case
A paper mill's slitting machine runs 100,000 minutes per year. During operation, workers must replace core spindles and adjust blade gaps.
Activity
Calculation
Annual time
Machine running
—
100,000 min
Core spindle replacement (19,000 times × 7 min)
19,000 × 7
133,000 min
Spindle replacement + blade adjustment (1,000 times × 15 min)
1,000 × 15
15,000 min
Total worker time required
—
248,000 min (4,133 hrs)
Subtracting machine run time from total time gives pure labor time. Dividing by available worker hours determines how many workers are needed — and whether any worker has enough idle time to absorb additional duties.
What to Review After Charting
Man-Machine Chart Review Points
Is the idle time for the worker or machine excessive?
Can manual tasks be shifted so the worker can tend additional machines during the auto cycle?
Can manual time a be shortened to allow more machines?
Can the auto cycle time t be extended or optimized?
What is the unit cost at each machine count — which is lowest?
Gang Process Chart Review Points
Is worker idle time clustered or spread thin?
Can workers with long idle stretches absorb additional tasks?
Resequencing tasks — can headcount be reduced without bottleneck?
How often does the machine wait for a worker (machine delay)?
Standard Data Method — Setting Standard Time Without Measuring Every Time
The Concept
The standard data method organizes time study measurements by work element into a reference library. When a similar new job appears, standard time is calculated by looking up element times and summing them — no stopwatch needed.
The premise: similar work elements take similar time, varying predictably with physical parameters (diameter, depth, weight, area). Capture that relationship once as a formula or table; apply it repeatedly.
How to Build Standard Data
Break target operations into discrete work elements.
Conduct time studies on each element across enough repetitions to establish reliable normal times.
Identify the independent variables that drive time variation (diameter, depth, weight, etc.).
Fit the relationships as equations, tables, or graphs (simple or multiple regression).
Validate against a hold-out dataset before releasing to production planning.
Drilling Example
Drilling breaks into four elements: (1) clamp workpiece, (2) position drill, (3) drill hole, (4) unclamp. Drilling time varies with hole diameter and depth. Pre-measured tables for each combination let planners sum element times from a drawing — no floor observation needed.
Multiple Regression Example — Office Cleaning
Cleaning time depends on multiple factors simultaneously. Multiple regression handles this:
NT = 0.85 + 0.001V1 + 0.003V2 + 0.12V3
V1: floor area (m²)
V2: number of furniture items
V3: number of floor changes
A cleaning service company uses exactly this kind of equation to estimate labor hours for a bid — without sending someone to measure every room.
Pros and Cons
Advantages
Disadvantages
No floor measurement needed for each new job
Building the database takes significant upfront time and cost
New products get standard time quickly
Scope is limited to the range of data collected
Consistent results regardless of analyst
Must be rebuilt when methods or equipment change
Ready for estimating and production planning
Requires measurement specialists for initial construction
PTS — Synthesizing Time from Motion Elements
The Concept
Predetermined Time Standards (PTS) assign standard times to basic motions — reach, grasp, move, release — then synthesize task time by decomposing work into those motions and summing up.
Think of it like Lego bricks. Any complex structure is just basic bricks assembled in a pattern. If you know the size (time) of each brick, you can calculate the total size before a single brick is laid — before the work even exists.
This is PTS's defining advantage: standard time can be determined during product or equipment design, before any physical operation begins.
Major Systems
MTM (Methods-Time Measurement): Developed by Maynard, Stegemerten, and Schwab in 1948. Classifies basic motions as Reach, Move, Turn, Apply Pressure, Grasp, Position, Release, and Disengage — each timed by distance, weight, and motion class.
WF (Work Factor): Developed by Quick, Shea, and Koehler. Quantifies motion difficulty through "work factors" for direction control, care, and precision.
Both systems use TMU (Time Measurement Unit) as the time unit: 1 TMU = 0.036 seconds.
Pros and Cons
Advantages
Disadvantages
Standard time set before production begins
Analyst training takes 6 months to 1 year
Motion analysis and method improvement happen simultaneously
Motion classification still contains some subjectivity
No stopwatch needed — usable in lab or design stage
Not suited for cognitive or decision-intensive tasks
International standard enables cross-company comparison
Very fine-grained decomposition takes considerable time to document
Which Method to Use When
Method
Best when
Key requirement
Stopwatch study (Part 2)
Work is already running on the floor
Observable, repeatable operation
Standard data
Similar jobs arise frequently
Accumulated historical measurement data
PTS
Design phase, before work exists
Work decomposable into basic motions
In practice, the three methods often work in sequence. PTS sets design-stage standards; after launch, stopwatch studies refine them; as variants multiply, standard data takes over. Knowing which tool to reach for — and when — is the core of industrial engineering work measurement.
댓글Comments